
Algo Trading: Finding Out What Works And What Doesn't
NOTE FROM KEVIN: This article was originally published a few years ago. If you'd like to see an update for 2022 (does algo trading work? do the conclusions still hold?), shoot me a quick e-mail and let me know. If enough people are interested, I'll take some time and do the update. If you are subscribed to my list, you'll be notified when the new article is released.
Mechanical Trading, Systematic Trading, Rule-Based Trading: Does It Work?
Many traders who try algo trading have previously had difficulty at discretionary or manual trading. Most of these folks eventually recognize the benefit of trading a system with well defined rules – a system that has performed well in the past. It is nice to know a trading approach has historically worked, but as with all things related to trading, past performance is no guarantee of future results.
Unfortunately, many people who try systematic/algorithmic/mechanical/rule-based trading for the first time bring along a lot of the baggage that they have acquired from their previous method. Depending on the pre-conceived notions they bring into mechanical trading, these new algo traders may run into a lot of frustration and trouble.
Many times, for example, traders will always test with a few core concepts, such as always closing by the end of the day. Or maybe they feel breakeven stops are a definite "must have."This is what they were used to as a discretionary or manual trader, and therefore they never even think to test ideas out of their old comfort zone. Perhaps removing these “comfort” rules would dramatically improve performance.
In this article, I will examine three common items that new systematic traders test, and see how these items actually work when they are subjected to rigorous testing.
Algorithmic Trading Testing & Development
Ground Rules
In all the testing that follows, I will test in 7 different markets, across a range of commodities:
- Wheat (W)
- 10 Year Treasury Notes (TY)
- Lean Hogs (LH)
- Australian Dollar (AD)
- Heating Oil (HO)
- Cotton (CT)
- e-mini Nasdaq (NQ)
Finally, I will assume $5 round turn commissions, and $30 round turn slippage. The $30 slippage might be excessive, but I’ve always found it is better to be conservative than to underestimate slippage. I’d rather not be disappointed in real time with larger than expected slippage. Remember, the whole idea here is to see is algo trading works, so it is good to be conservative with calculations.
The System
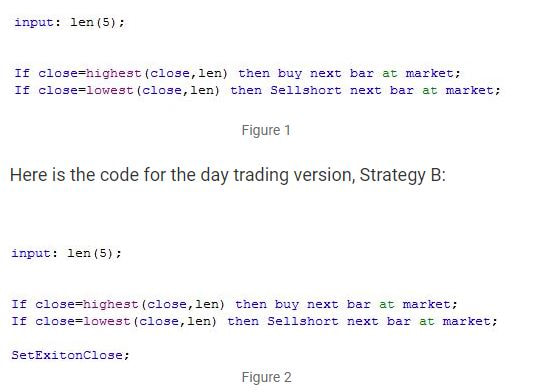
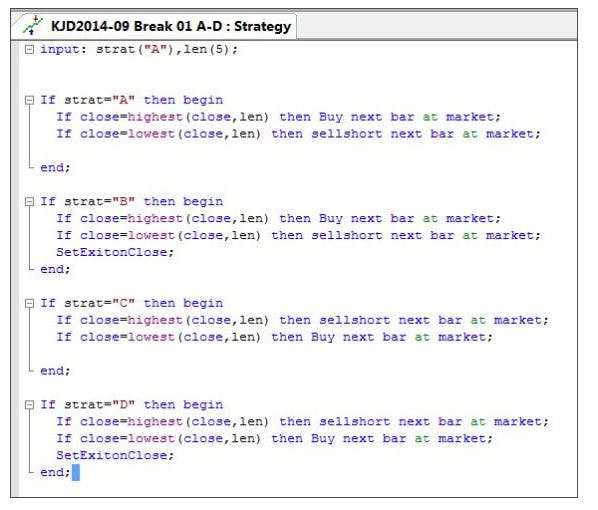
I will use an extremely simple strategy for the tests I am running: a simple breakout based on closing prices. The system is always long or short, and will enter at the next bar open, long if the close is the highest close of the past X bars, and short if the close of the lowest close of the last X bars. One version of the system always exits at the end of the day, and the other version is a swing system. X will be varied from 5 bars to 100 bars.
Here is the code for the swing version, Strategy A:
Day, or Night?
Since most markets these days run nearly 24 hours, we can run into issues when testing historically, as many markets traded “pit” hours years ago. Because of that, and because most of the volume is during these traditional pit hours, I will use the old pit session times, but still use electronic trading data.
Exit 1 Minute Before Close
If you use Tradestation to test, you may be familiar with their keyword “setexitonclose.” This is a neat function for backtesting, but in live trading the order is sent after the market is closed, rendering it ineffective. So, I set up the custom sessions above to exit 1 minute before the old “pit” closing time. Then, I know my strategy will exit properly, and will therefore work in backtest and in real time.
Final Pre-Test Info
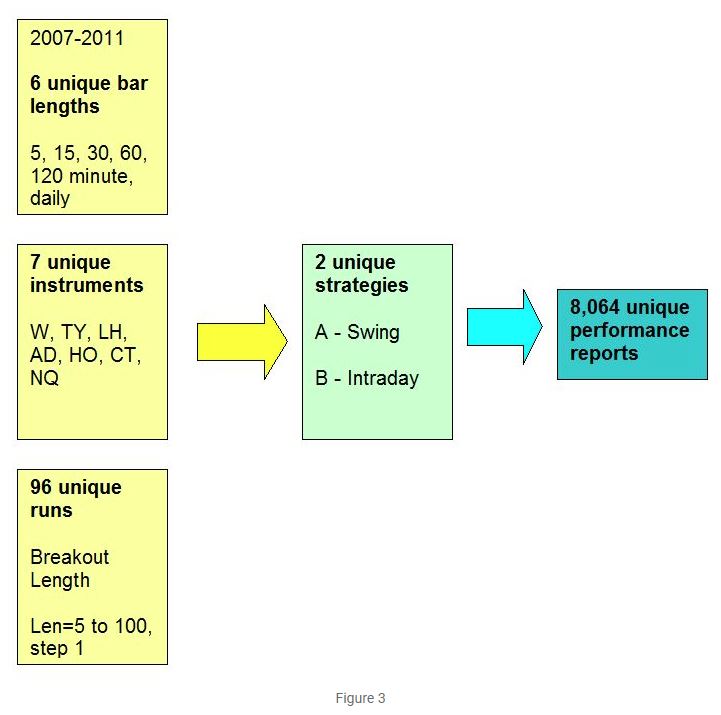
Now that we have everything properly setup, it is time to run some tests. For each instrument given above, I will run tests with 5, 15, 30, 60, 120, and Daily bars. That gives us 7 instruments x 6 bar sizes = 42 tests. Then, for each test, I will run the breakout length X from 5-100 in steps of 1, which yields 96 iterations per test. Since I am running two strategies overall, I am running 42 x 96 x 2 = 8,064 unique performance sets.
For each of the 42 tests for each strategy, I will record the best Net Profit (out of the 96 iterations) and its corresponding maximum drawdown (if best Net Profit is greater than zero). For each of the 42 tests, I will also record the percentage of iterations that are profitable.
All the tests being run are shown graphically in Figure 3.
Since most markets these days run nearly 24 hours, we can run into issues when testing historically, as many markets traded “pit” hours years ago. Because of that, and because most of the volume is during these traditional pit hours, I will use the old pit session times, but still use electronic trading data.
Exit 1 Minute Before Close
If you use Tradestation to test, you may be familiar with their keyword “setexitonclose.” This is a neat function for backtesting, but in live trading the order is sent after the market is closed, rendering it ineffective. So, I set up the custom sessions above to exit 1 minute before the old “pit” closing time. Then, I know my strategy will exit properly, and will therefore work in backtest and in real time.
Final Pre-Test Info
Now that we have everything properly setup, it is time to run some tests. For each instrument given above, I will run tests with 5, 15, 30, 60, 120, and Daily bars. That gives us 7 instruments x 6 bar sizes = 42 tests. Then, for each test, I will run the breakout length X from 5-100 in steps of 1, which yields 96 iterations per test. Since I am running two strategies overall, I am running 42 x 96 x 2 = 8,064 unique performance sets.
For each of the 42 tests for each strategy, I will record the best Net Profit (out of the 96 iterations) and its corresponding maximum drawdown (if best Net Profit is greater than zero). For each of the 42 tests, I will also record the percentage of iterations that are profitable.
All the tests being run are shown graphically in Figure 3.
Questions To Answer
Once all the tests are run, I will see if I can answer the three questions below. These questions are directly related to the desires of many discretionary day traders.
Before I get to the results, I should point out that this is one study, with two strategies, across only seven markets. So, the conclusions I reach may not hold up over all markets, and may be different for different strategies. I’m guessing, though, that the conclusions probably do hold in general.
Results
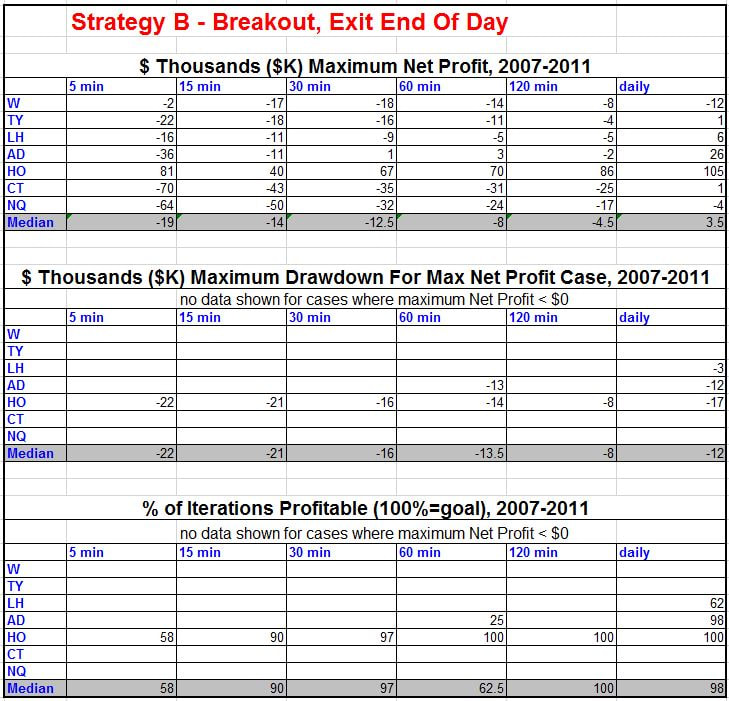
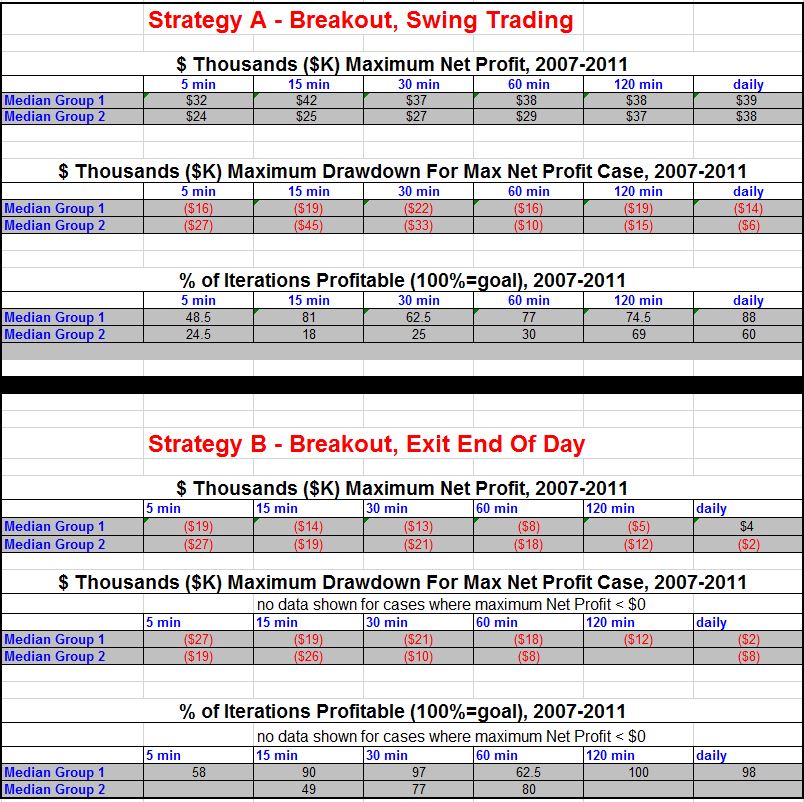
Results of all 8,046 performance tests are shown in Table 1 for the swing Strategy A, and Table 2 for the intraday Strategy B. I will refer to these results as I discuss each of the three questions.
Strategy A- Breakout, Swing Trading
Once all the tests are run, I will see if I can answer the three questions below. These questions are directly related to the desires of many discretionary day traders.
- Many traders love strategies that are the same across multiple instruments. An example of this is price action trading – many feel the principles of price action hold across all instruments. So, when these traders test algorithms, one demand is that a strategy is viable ONLY if it is profitable across many instruments. Question: Is multiple market profitability a reasonable requirement?
- Most day traders need to be out by the end of the day. ** Question: Does forcing an exit at the end of each day improve or decrease strategy performance?**
- Many day traders try to go for the smallest (shortest) bar size possible. The theory is that trades will be more frequent, losses will be smaller, and exits will be more responsive to market conditions. Question: What kind of impact does bar size have on performance?
Before I get to the results, I should point out that this is one study, with two strategies, across only seven markets. So, the conclusions I reach may not hold up over all markets, and may be different for different strategies. I’m guessing, though, that the conclusions probably do hold in general.
Results
Results of all 8,046 performance tests are shown in Table 1 for the swing Strategy A, and Table 2 for the intraday Strategy B. I will refer to these results as I discuss each of the three questions.
Strategy A- Breakout, Swing Trading
Algorithmic Swing Trading
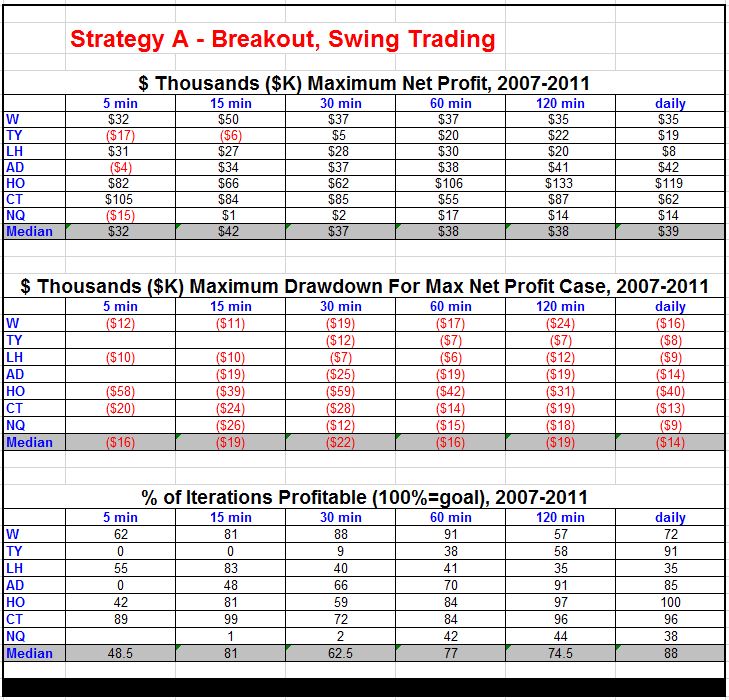
Table 1 is above, Table 2 is below...
Strategy B- Breakout, Exit End Of The day
Strategy B- Breakout, Exit End Of The day
Algorithmic Breakout Trading
1. Is profitably across multiple instruments a reasonable requirement?
Figures 4 and 5 show the best case Net Profit for both the swing and intraday version of the strategy. With one notable exception (Heating Oil intraday trading), what is good in one market is generally good in another market. Although the maximum profit varies wildly from market to market, all the swing markets are profitable, and all but one of the intraday markets are unprofitable. This should give you some confidence that the strategy is sound (or not). Of course, it doesn’t mean the strategy is tradable in each market, since I am looking only at maximum net profit based on optimization. But, clearly the intraday Strategy B is not viable in most markets.
Figures 4 and 5 show the best case Net Profit for both the swing and intraday version of the strategy. With one notable exception (Heating Oil intraday trading), what is good in one market is generally good in another market. Although the maximum profit varies wildly from market to market, all the swing markets are profitable, and all but one of the intraday markets are unprofitable. This should give you some confidence that the strategy is sound (or not). Of course, it doesn’t mean the strategy is tradable in each market, since I am looking only at maximum net profit based on optimization. But, clearly the intraday Strategy B is not viable in most markets.
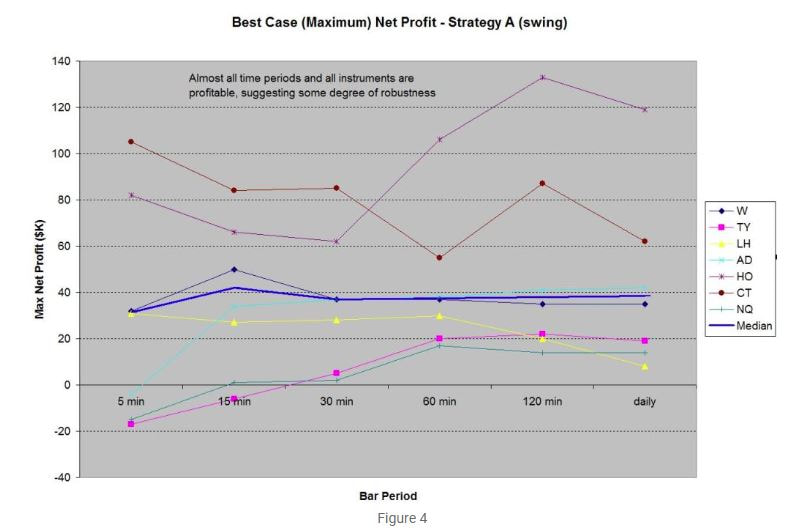
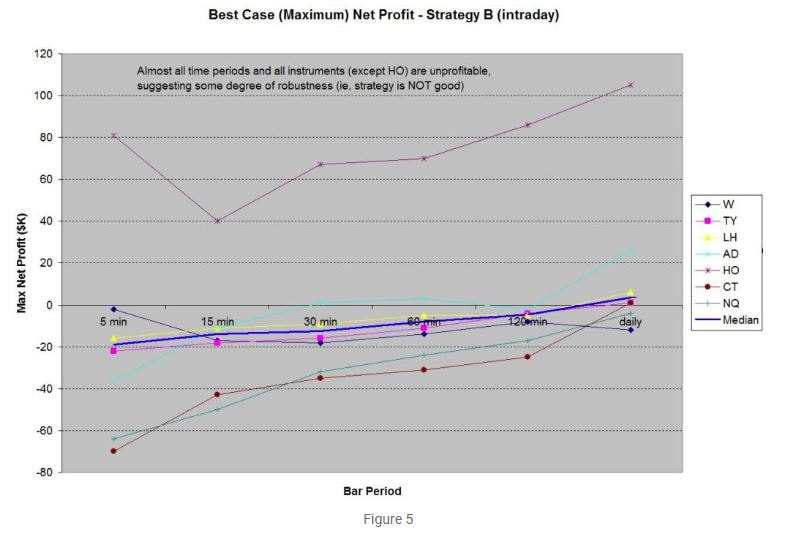
2. Is exiting end of day (intraday trading) a good idea?
Figure 5 shows the answer loud and clear – the answer is no. You’ll get more profit by swing trading. Unfortunately, it might also mean enduring more drawdowns, but think of it like this: the market “pays” people for holding overnight and weekends, and taking on that risk.
3. Are shorter timeframes better?
Since Strategy A is clearly the better strategy, I will use those results to look at the impact of bar length (timeframe). This is shown in Figure 6, where I look at the percent of iterations that were profitable for each combination of instrument and bar size. So, for example, Wheat with 5-minute bars shows that 62% of iterations were profitable (denoted with a red circle in Figure 6). This means that as I varied the breakout length from 5 to 100 in increments of 1 (96 total iterations), 60 of those runs resulted in a profitable end result. Obviously, the best case is 100% – where no matter what value you use for breakout length, the end result is positive.
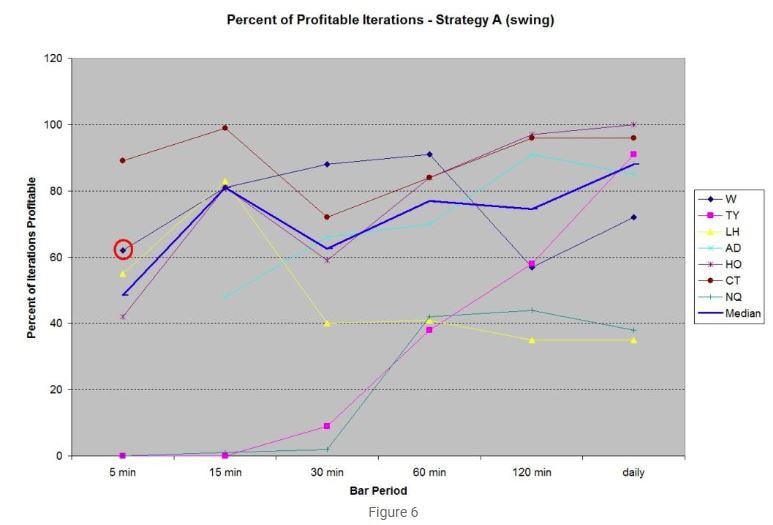
Results of Figure 6 show that in general profitability increases as the bar length increases, although this effect is not very pronounced, and it does not hold for all instruments. This is confirmed by the results of Figure 4, where the maximum Net Profit generally increase with increasing bar period, but not dramatically.
Why is this so? Profitability could be better as bar period increases, since random market noise plays a smaller role in longer period bars (i.e., the true trend is more easily seen in larger period bars). Of course, drawdown should also be considered when looking at bar size, but in this study it does not seem to change greatly with bar size.
Conclusion So Far
Results with this simple strategy lead to three conclusions:
- Striving for profit in multiple markets, as a confirmation of a strategy, is indeed possible.
- Swing trading is likely more profitable than intraday trading.
- Longer timeframes are generally superior to short time periods, but this is not a major effect.
Follow On
Of course, I made these conclusions based on one study. What if the strategy was different? What if the timeframes or markets were different? What if different years were used for the test period? Will the conclusions reached here still hold? I’ll examine those questions below.
So, far, I ran a simple study of a trading system, in order to look at some of the common components (such as end of day closes, short versus long bar periods) that many system developers add to their trading system. Could some of these strategy building blocks be hurting their development efforts? To answer the question, I analyzed one trading system over 7 different markets for a 5 year period. Even though I was able to extract some conclusions from the study, I also said the following:
“Of course, I made these conclusions based on one study. What if the strategy was different? What if the timeframes or markets were different? What if different years were used for the test period? Will the conclusions reached here still hold? I’ll examine those questions.”
In this second part of the study, I’ll now look at a different group of markets, a completely different strategy and some different timeframes. I’ll also try to answer the following questions: Will the conclusions still hold up? What type of insights, if any, do conducting studies like these actually provide? Finally, can studies like these improve your own strategy development?
For this follow on, I will test another basket of commodities.
Group 2:
- Live Cattle (LC)
- Canadian Dollar (CD)
- Copper (HG)
- Natural Gas (NG)
- Sugar (SB)
I will also test a different time period starting in 1/1/2012, a smaller test period outside of the range previously tested.
Finally, I will assume $5 round turn commissions and $30 round turn slippage.
The Systems
I will use two extremely simple base strategies for the tests I am running: a simple breakout based on closing prices (Strategies A and B), or a reverse breakout (countertrend – Strategies C and D). In all cases, the breakout length X will be varied from 5 bars to 100 bars.
Here is the code for all four versions of the strategy:
The results of Group 2 are generally in line with Group 1 results, which show that swing trading (strategy A) is better than intraday trading (Strategy B), and that longer timeframes are slightly better than short timeframe bars.
Results–Different Timeframes, Different Time Period, Different Strategy
Of course, concluding that long timeframe bars and swing trading is superior based on only a few tests is dangerous. So, let’s look at Strategies C & D (the opposite Strategies of A & B), and see if the results have the same tendencies for different timeframes and test period, on a random subset of Group 1 and Group 2 instruments.
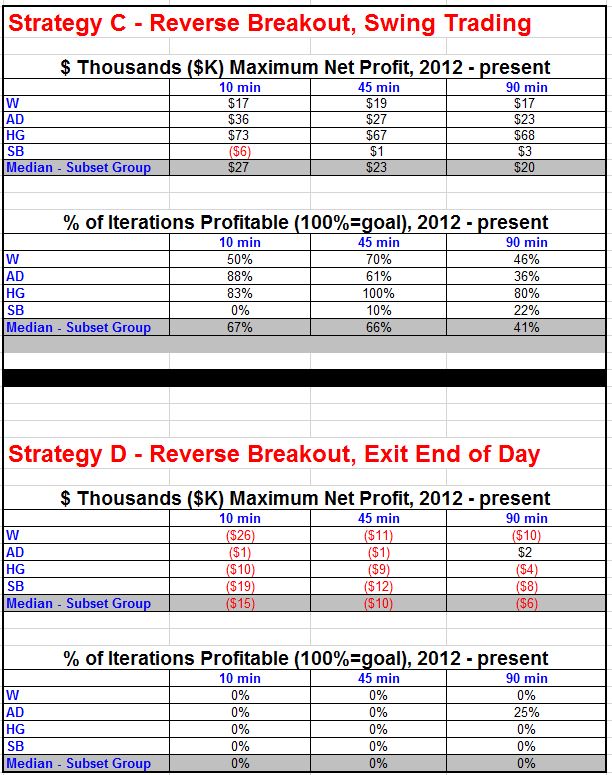
For timeframes, the results show a tendency for the smaller timeframes to be better than the longer timeframes, exactly the opposite of what was found earlier. But this effect is small, which could mean it is not actually true, and could be just an artifact of the limited testing. This is a good example why it is dangerous to draw conclusions from only a few tests.
For the swing vs. intraday testing, the results are pretty clear – intraday testing is not nearly as good as swing trading. This agrees with the earlier conclusion.
Conclusion
Through both sectionsof this study, a lot of tests have been run over various bar timeframes, instruments, strategies and time periods. Yet, it would be dangerous to make any sweeping conclusions based on these tests. Although these results show that intraday trading is less profitable than swing trading, there are surely cases where intraday trading is preferable over swing trading.
So, what can this study actually teach us? I think the following lessons come out of this study:
The key to successful strategy testing and development is to keep an open mind, and allow the data to point you in the right direction. At the same time, though, don’t let the data trick you into making false conclusions or sweeping generalizations. Remaining flexible in your development approach can lead to new and profitable strategies – ones that you might now be dismissing based solely on past testing.
For the swing vs. intraday testing, the results are pretty clear – intraday testing is not nearly as good as swing trading. This agrees with the earlier conclusion.
Conclusion
Through both sectionsof this study, a lot of tests have been run over various bar timeframes, instruments, strategies and time periods. Yet, it would be dangerous to make any sweeping conclusions based on these tests. Although these results show that intraday trading is less profitable than swing trading, there are surely cases where intraday trading is preferable over swing trading.
So, what can this study actually teach us? I think the following lessons come out of this study:
- Intraday trading is less profitable than swing trading. This does not mean this always holds, but if you do most of your testing intraday and you are struggling to develop a strategy, perhaps opening up the strategy to allow swing trading is a good idea. It could be that you have a good swing strategy, but the end of day exit alone makes the strategy look bad.
- Longer timeframes are better (Part 1 conclusion), except when they aren’t (Part 2 conclusion). So, be careful of making conclusions when the effect is small, or results are contradictory. Since many strategy developers tend to find something that does or does not work and then focus only on that (or avoid it), the lesson here is that the developer should not “box” themselves in. Maybe short timeframes rarely work with your strategies, but that does not mean you should never test them. There will be other strategies where shorter time bars are an asset.
- Since a developer can never test everything, it may be worthwhile to vary your test approach. By looking at different timeframes, instruments, etc., you may discover new paths to take in your strategy development.
The key to successful strategy testing and development is to keep an open mind, and allow the data to point you in the right direction. At the same time, though, don’t let the data trick you into making false conclusions or sweeping generalizations. Remaining flexible in your development approach can lead to new and profitable strategies – ones that you might now be dismissing based solely on past testing.

About The Author: Kevin Davey is an award winning private futures, forex and commodities trader. He has been trading for over 25 years.Three consecutive years, Kevin achieved over 100% annual returns in a real time, real money, year long trading contest, finishing in first or second place each of those years.
Kevin is the author of the highly acclaimed book "Building Algorithmic Trading Systems: A Trader's Journey From Data Mining to Monte Carlo Simulation to Live Trading" (Wiley 2014). Kevin provides a wealth of trading information at his website: https://kjtradingsystems.com
Copyright, Kevin Davey and KJ Trading Systems. All Rights Reserved. Reprint of above article is permitted, as long as the About The Author information is included.