
Monte Carlo Simulation and Stock Trading Systems
Building An Algorithmic Trading System
Despite what anyone tells you, trading is hard. And developing a trading strategy (algorithm) is hard. I should know - I've been building these algo strategies for a long time - almost as long as I can remember!
To build an algo properly, you have to do a number of things correctly. For example, you have to know how not to over-optimize your strategy. Easier said than done! I discuss a lot of the "best practices" in another article that focuses on testing and development.
In this article, though, I am going to focus on what happens AFTER you test and optimize your strategy.
Algorithmic Trading System Testing & Development
What Should I Do After Testing & Optimization?
Every trader knows how hard it is to come up with trading systems that have a sustainable edge. Many people can look at a chart and determine some trading rules that fit a particular chart perfectly. However, when they test their rules over a large amount of market history, they see their system is really worthless.
Other traders will develop a system neglecting commissions and slippage. The trading system looks great, and the trader is very enthusiastic, until these real life frictional costs are added in, and a winning system turns into a breakeven system or worse.
Improve Algorithmic Trading
If you are having trouble building an algo trading strategy, you really have to understand HOW to properly build an algo. With a proper test and development method, it is common for traders to test dozens, hundreds or even thousands of trading ideas before they find one that works. A sound development process, like the Strategy Factory process I discuss in my algo trading books, eliminates a lot of worthless trading systems.
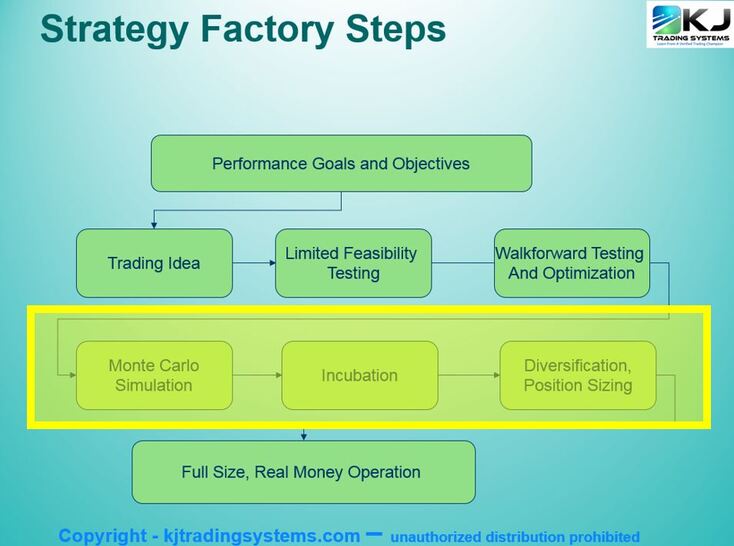
Here is what my strategy development process looks like. I've highlighted the process steps I am discussing in this article:
Here is what my strategy development process looks like. I've highlighted the process steps I am discussing in this article:
A lot of traders assume that the testing - the optimization, walkforward testing, etc. - is the majority of the development process. Yet, once a trading system passes initial development and testing, work is far from done. There are more steps necessary before committing real funds to a trading system. Following these "after development" rules can save a trader thousands of dollars, and eliminate a lot of heartache.
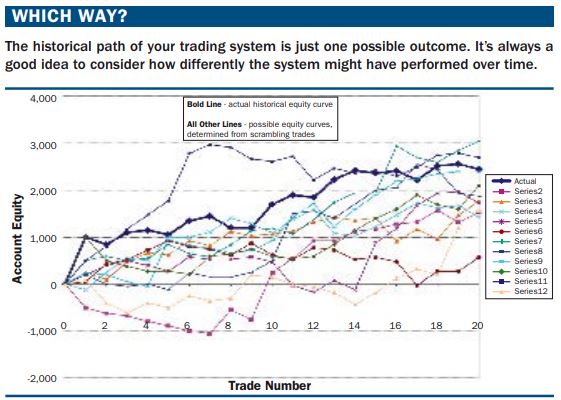
One mistake traders make is to base their trading decisions on the shape of the historical backtest equity curve. Many traders will look at the equity curve and think "since the historical maximum drawdown is $X, I'll probably never have a larger drawdown than that." Or they will say "this system has made money every year, so it is safe to trade."
Unfortunately, both of these assumptions are very, very wrong. This is because the historical equity curve is just one of many possible paths the trading system could have taken over time. This is depicted in Figure 1. Rearrange a few trades here and there, and the maximum drawdown could have been much worse, and profitable periods could easily have become losing periods. On the flip side, the performance could have been better than what it was, too.
Monte Carlo Simulation - Stock Trading Systems & Futures Trading Systems
Is there a way to analyze this phenomenon - to see the various different paths a trading system could have taken? Yes, there is, with a method called Monte Carlo analysis. You can download a free Monte Carlo simulator at my Calculators page.
Monte Carlo analysis is based on the idea that trades in the past will occur in the future, just in some different, and unknown, order. By scrambling up the trades in a different order, different equity curves will be generated.
Although there are circumstances where Monte Carlo testing is not appropriate, for most trading systems, the analysis is valid, and can provide great insight into the trading system's characteristics. With Monte Carlo analysis, you simply write each trade result on a piece of paper, drop them in a hat, and then pick trades out one by one to create an equity curve. Computers can obviously do this sampling process a lot faster, and create thousands of simulated equity curves in seconds.
When you analyze thousands of Monte Carlo simulations, you obtain statistics of what the biggest drawdown could be, what annual return is possible, and what your risk of ruin is. If you have performance objectives for simulation results, you can then easily see if your system meets your goals. There is no way to obtain such information from just looking at the historical equity curve.
Trading Systems Extra Steps
Incubation
When most traders finish developing a strategy, they typically are so excited (who can blame them?) that they rush into real money trading. This can be a big mistake, especially for newer traders. A lot of this has to do with trading software. Most modern trading software makes it very easy to create systems, modify rules and perform multiple optimizations. In fact, most software is set up to encourage optimization - the software makes it very easy to do.
When most traders finish developing a strategy, they typically are so excited (who can blame them?) that they rush into real money trading. This can be a big mistake, especially for newer traders. A lot of this has to do with trading software. Most modern trading software makes it very easy to create systems, modify rules and perform multiple optimizations. In fact, most software is set up to encourage optimization - the software makes it very easy to do.
So, with the software promoting a lot of these bad habits, the historical equity curve will invariably look better with each new test. But, most of the time a better looking backtest has zero (or even negative) correlation to future performance. Why is this? Simply put, adding rules, filters and running more optimizations have the effect of fitting the trading strategy to the historical data. The reality is that a trader wants the exact opposite; a trading strategy that performs well on previous data, but isn't fit to it. Those types of systems work better going forward.
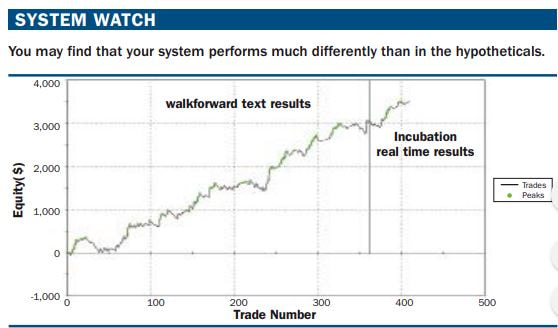
Many times, watching the strategy after development yields important clues. This process is called incubation. In its simplest form, you let the strategy run live, but without actually trading it, for a period of 3 to 6 months. Once a month, you look at the results and add those new results to your historical backtest equity curve. An example of this is shown in Figure 2, where the incubation results are added on to the walkforward historical results. Since in this case the incubation results look similar to the historical results, it gives the trader confidence that strategy development was performed correctly.
After a few months of incubation, you'll likely see one of 2 things: the performance of the system "looks" the same as the historical testing, or it does not. One trick is to print the equity curve (historical and incubated performance) as large as possible, and tape it to a wall about 10 feet away. If you can see where the historical testing ended and where incubation began, you have a problem. Ideally, there should be no change in performance between the historical and incubation results.
There are more statistically oriented tests that you can run on strategy results to determine if performance has changed. A histogram of daily results is one such method. Again, the point is to see whether or not the system performance changes after you developed the system. What could cause a performance change? Certainly, if the market is behaving differently than anytime during the tested history, the performance could dramatically change. Assuming you have tested over years of data, though, this is probably not too likely. More likely is that there was a mistake made during development. For example, the strategy might have been overoptimized, with too many variables. Or, possibly the developer looked at current data before selecting his rules, which is a form of hindsight bias.
Monte Carlo Simulation In Trading
Correlation Analysis
So, with the software promoting a lot of these bad habits, the historical equity curve will invariably look better with each new test. But, most of the time a better looking backtest has zero (or even negative) correlation to future performance. Why is this? Simply put, adding rules, filters and running more optimizations have the effect of fitting the trading strategy to the historical data. The reality is that a trader wants the exact opposite; a trading strategy that performs well on previous data, but isn't fit to it. Those types of systems work better going forward.
Many times, watching the strategy after development yields important clues. This process is called incubation. In its simplest form, you let the strategy run live, but without actually trading it, for a period of 3 to 6 months. Once a month, you look at the results and add those new results to your historical backtest equity curve. An example of this is shown in Figure 2, where the incubation results are added on to the walkforward historical results. Since in this case the incubation results look similar to the historical results, it gives the trader confidence that strategy development was performed correctly.
After a few months of incubation, you'll likely see one of 2 things: the performance of the system "looks" the same as the historical testing, or it does not. One trick is to print the equity curve (historical and incubated performance) as large as possible, and tape it to a wall about 10 feet away. If you can see where the historical testing ended and where incubation began, you have a problem. Ideally, there should be no change in performance between the historical and incubation results.
There are more statistically oriented tests that you can run on strategy results to determine if performance has changed. A histogram of daily results is one such method. Again, the point is to see whether or not the system performance changes after you developed the system. What could cause a performance change? Certainly, if the market is behaving differently than anytime during the tested history, the performance could dramatically change. Assuming you have tested over years of data, though, this is probably not too likely. More likely is that there was a mistake made during development. For example, the strategy might have been overoptimized, with too many variables. Or, possibly the developer looked at current data before selecting his rules, which is a form of hindsight bias.
Correlation With Other Systems
Another area many traders neglect after system development is correlation to other systems. Obviously, if you are trading only one system, you have nothing to worry about. But, if you are adding a system to your trading portfolio, you have to ensure that your new system complements your other systems. You don't want all your systems buying and selling at the same time. In other words, you desire to have your systems as uncorrelated as possible.
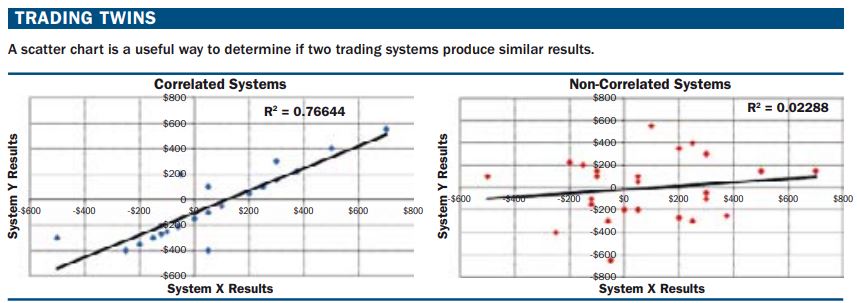
One way to achieve correlation is to trade different markets and different timeframes. Many times, that will provide sufficient correlation. If you like mathematical proof of correlation, you can run a linear regression of trading system results. The best way to do this is to compare results of the two strategies, and see what the correlation coefficient is. If the results are between -0.5 and +0.5, you have a pair of systems that are not correlated with each other. Figure 3 shows what correlated systems and non correlated systems might look like. Traders should always aim to trade non-correlated systems, and avoid correlated ones.
Correlation of systems is important because a key factor in trading is proper risk control. When two or more systems are highly correlated, your risk level increases dramatically. As an alternative, you really want systems that are not correlated. This creates a smoother equity curve, and is a key component to proper diversification.
Limited Real Money Tests
After you have run Monte Carlo simulation of your stock trading systems, incubated for system for a few months, and checked that your new system is not correlated to other systems you are trading, it may be time to test with actually trading a small amount of contracts.
Why only a small number of contracts, instead of a large number? There are a few reasons this is recommended. First, there is still a chance that systems passing all previous steps might still fail. Second, trading small is a great way to check assumptions you made regarding slippage. You may find that slippage is a lot more, or a lot less, than you have anticipated, and therefore your position sizing approach when you go full size might change. Finally, you might decide you do not like the system, even though it produces profits. Many people who like trend following, for example, have trouble trading mean reverting strategies. It is much better to find out you don't like trading a system while you are trading small.
Algorithmic Trading System Testing & Development
Conclusion
After a system is developed, it is clear that real money trading is not the next step. Instead, proceeding with caution and carrying on with more analysis is the best approach. From Monte Carlo simulations to incubation to correlation analysis and limited real money testing, performing these extra steps can save your trading account, and you, a lot of heartache. In the end, you'll have a more robust strategy, and a more realistic view of what to expect when trading the strategy with real money.
After a system is developed, it is clear that real money trading is not the next step. Instead, proceeding with caution and carrying on with more analysis is the best approach. From Monte Carlo simulations to incubation to correlation analysis and limited real money testing, performing these extra steps can save your trading account, and you, a lot of heartache. In the end, you'll have a more robust strategy, and a more realistic view of what to expect when trading the strategy with real money.

About The Author: Kevin Davey is an award winning private futures, forex and commodities trader. He has been trading for over 25 years.Three consecutive years, Kevin achieved over 100% annual returns in a real time, real money, year long trading contest, finishing in first or second place each of those years.
Kevin is the author of the highly acclaimed book "Building Algorithmic Trading Systems: A Trader's Journey From Data Mining to Monte Carlo Simulation to Live Trading" (Wiley 2014). Kevin provides a wealth of trading information at his website: https://kjtradingsystems.com
Copyright, Kevin Davey and KJ Trading Systems. All Rights Reserved. Reprint of above article is permitted, as long as the About The Author information is included.