
Trailing Stops And Dollar Stops
Can These 378,000 Backtests Beat Stop & Reverse Exits?
In an earlier article, I ran over 500,000 algo backtests to see which exit performed the best. I looked at all kinds of exits:
Simple Exits
1. Stop and Reverse Exit
2. Time Based Exit
3. Dollar Stop Loss
4. Dollar Profit Target
5. Dollar Stop With Profit Target
6. Average True Range Stop Loss
7. Average True Range Profit Target
8. Average True Range Stop With Profit Target
Intermediate Exits
9. Trailing Stop
10. Breakeven Stop
Complicated Stops
11. Parabolic Stop
12. Chandelier Stop
13. Yo-Yo Stop
14. Channel Exit
15. Moving Average Exit
Combination Exits
16. Dollar Target with Breakeven Exit
17. Dollar Target with Trailing Exit
18. Dollar Stop with Breakeven Exit
19. Dollar Stop with Trailing Exit
20. Dollar Stop/Target with Breakeven Exit
21. Dollar Stop/Target with Trailing Exit
I ran each of these exits with 5 different entries:
1. Simple Momentum Entry
If close>close[InputVar2] then buy next bar at market;
If close<close[InputVar2] then sell short next bar at market;
2. Breakout Next Bar Entry
If high=highest(high,InputVar2) then buy next bar at market;
If low=lowest(low,InputVar2) then sell short next bar at market;
3. Single Moving Average Cross Entry
If close crosses above average(close,InputVar2) then buy next bar at market;
If close crosses below average(close,InputVar2) then sell short next bar at market;
4. Bollinger Band Entry
If close crosses above BollingerBand( close, InputVar2, -2) then buy next bar at market;
If close crosses below BollingerBand( close, InputVar2, +2) then sell short next bar at market;
5. Volatility Entry
If Close> close[1] + AvgTrueRange( InputVar2 ) * 1.5 then buy next bar at market;
If Close< close[1] - AvgTrueRange( InputVar2 ) * 1.5 then sellshort next bar at market;
Out of those 21 exits, one reigned supreme: the simple Stop and Reverse exit.
Not exactly what I expected, and judging from the comments I received, many of you traders did not expect that either!
At the end of this study, I put my “Exit Challenge” out there. I invited readers to submit any exit that they thought could outperform the simple Stop & Reverse.
The response was pretty solid, with entries coming from all over the globe. I threw in some of my own “contestant” exits, and ended up testing 13 unique exits.
Before I discuss the Exit Challenge, I think it is important to discuss 3 popular types of exits:
Trailing Stops
Average True Range Stops
Dollar Stops
Trailing Stop Loss - Any Good?
A trailing stop is exactly what you might think - a price that trails below the current price (for long trades), and gets you out of the market if the price moves too far in a losing direction. This kind of stop could be used to limit the loss on the trade, or to protect profit.
For example, you could have a long trade trailing stop always be $500 below the most recent low. That could limit the initial loss to $500, and as the price moved up, the stop would also move up, still being $500 below the most recent low. Even if you were in a profitable trade, you'd always be trailing with a $500 stop loss, therefore protecting a lot of your profit.
This type of trailing stop is very popular - it feels good psychologically - but from a financial point of view, it is not necessarily better than a simple stop & reverse.
What is An Average True Range Stop?
In Tradestation, a simple 14 period Average True Range stop would be coded like this:
SetStopLoss(X * AvgTrueRange(14)* BigPointValue);
The benefit of an average true range stop is that it reacts to current volatility. In very volatile markets, the stop value gets bigger, supposedly keeping your stop out of the noise level. On the downside, the stop in dollar terms may become huge, which is not good either.
One alternative to the average true range stop is to use it with a dollar floor or ceiling. I describe that in this article. That way, the stop is still responsive to market volatility, but not too responsive.
What Does a Dollar Stop Look Like?
A dollar stop loss looks like this:
SetStopLoss(DollarAmount);
where DollarAmount is whatever value you want (usually in dollars per contract, but can be in dollars per position too).
Lots of traders do not like this dollar stop, because it is independent of market volatility. Yet, in my testing, I find that it works better in many cases than Average True Range stops.
The best bet for any trader is to try both of these stops, and see which if any they like better.
Now back to the Exit Challenge...
Before we get to the results, I’ll first describe each exit (some with the code I used), and then lay out the testing framework I used. Realize that if you run a similar test on your own, you may get completely different results – depending on the assumptions and setup you use.
The Exit Challenge Contestants
Exit #1 Name: PP8175
Exit Description: This exit is designed to trail the position, with different levels of profit protection as the position profit increases. For example, once a maximum position profit of $1000 was locked in, then if the open profit drops below 50% of the maximum, the position is exited. At $2000 max profit, 65% of profit is saved and at $3000 profit 80% of max profit is saved.
Exit Code:
EXIT #01
*******************************************************************
//Exit Challenge Submittal
//Catchy Exit Name: PP8175
//Code:
//Inputs, ranges:
//ppfloor1 = 1000 to 3000, step 1000 (3 values)
//ppratio1 = .50 to .70, step .10 (3 values)
//set ppfloor and ppratio values to protect profit
Input: ppfloor1(1000); //don’t invoke exit 1 until $1000 profit level is reached
Var: ppfloor2(0); //don’t invoke exit 2 until ppfloor2 profit level is reached
Var: ppfloor3(0); //don’t invoke exit 3 until ppfloor3 profit level is reached
ppfloor2=2*ppfloor1;
ppfloor3=3*ppfloor1;
Var:ppratio(0); //depends on maxpositionprofit
Input:ppratio1(.60); //profit exit 1 keep ratio – keep 60% of maximum profit
Var:ppratio2(0); //profit exit 2 keep ratio – keep ppratio2 of maximum profit
Var:ppratio3(0); //profit exit 3 keep ratio – keep ppratio3 of maximum profit
ppratio2=ppratio1+.15;
ppratio3=ppratio2+.15;
If maxpositionprofit>=ppfloor1 then ppratio=ppratio1;
If maxpositionprofit>=ppfloor2 then ppratio=ppratio2;
If maxpositionprofit>=ppfloor3 then ppratio=ppratio3;
If maxpositionprofit>=ppfloor1 then begin
if (openpositionprofit/maxpositionprofit)<ppratio then begin
if marketposition=1 then Sell next bar at market;
if marketposition=-1 then Buy To Cover Next bar at market;
End;
End;
*******************************************************************
*******************************************************************
Exit #2 Name: SetPerReplace - Tradestation SetPercentTrailing Replacement
Exit Description:
Almost every new trader who uses Tradestation tries the built in “SetPercentTrailing” exit, and is amazed by the results. They usually get an equity curve that looks like this (and many times, even better than this!):
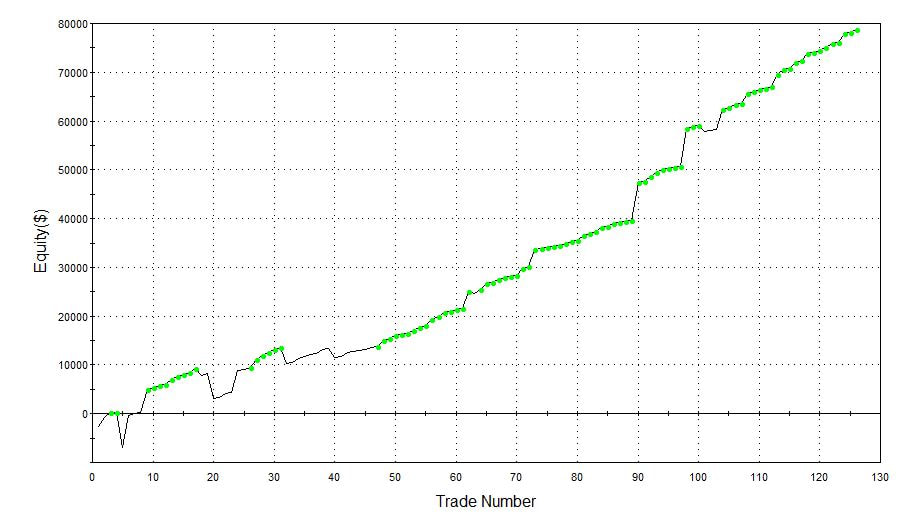
The problem is that, based on the way this built-in Tradestation function works, the results are very likely TOTALLY INACCURATE.
Because of this, Tradestation created a replacement of SetPercentTrailing, one that is accurate when you use 1 minute Look Inside Bar Backtesting.
Exit Code:
EXIT #02
*******************************************************************
{Exit Challenge Submittal
Catchy Exit Name: Tradestation SetPercentTrailing Replacement (https://community.tradestation.com/Discussions/Topic_Archive.aspx?Topic_ID=8714#46331)
//Inputs, ranges:
//FloorAmt = 500 to 2500, step 1000 (3 values)
//TrailingPct = 20 to 60, step 20 (3 values)
inputs:
PositionBasis( false ),
FloorAmt( 1 ),
TrailingPct( 20 ) ;
variables: BSE( 0 ), HH( 0 ), LL( 0 ), HighProfit( 0 ), CalcFloor( 0 ), Trail( 0 ), MyStopPrice( 0 ) ;
if MarketPosition <> 0 then
begin
BSE = BarsSinceEntry( 0 ) ;
CalcFloor = FloorAmt ;
if PositionBasis then
HighProfit = MaxPositionProfit( 0 )
else
HighProfit = MaxContractProfit( 0 ) ;
end;
if MarketPosition = 1 then
begin
HH = Highest( High, BSE ) ;
if HighProfit >= CalcFloor then
begin
Trail = (TrailingPct * .01) * ( HH - EntryPrice( 0 ) ) ;
MyStopPrice = HH - Trail ;
end;
end;
if MarketPosition = -1 then
begin
LL = Lowest( Low, BSE ) ;
if HighProfit >= CalcFloor then
begin
Trail = (TrailingPct * .01) * ( EntryPrice( 0 ) - LL ) ;
MyStopPrice = LL + Trail ;
end;
end;
if MarketPosition <> 0 and MaxPositionProfit > FloorAmt and MyStopPrice <> 0 then
begin
if MarketPosition = 1 then
Sell ("Alt%Trl LX") Next Bar at MyStopPrice Stop ;
if MarketPosition = -1 then
BuytoCover ("Alt%Trl SX") Next Bar at MyStopPrice Stop ;
end ;
Exit #3 Name: BoBo
Exit Description: This is a clever exit that uses pivot points for the trailing stop order
Exit Code: Not Available (Proprietary)
Exit #4 Name: MeowMeow - Percent Trailing with Target Combo
Exit Description: This neat exit uses both a percent trailing type exit along with a profit target
Exit Code: Not Available (Proprietary)
Exit #5 Name: LogExit
Exit Description: A cool little variation of a trailing stop
Exit Code: Not Available (Proprietary)
Exit #6 Name: ConsecCloses
Exit Description: All good things must come to an end, right? And if you’d had X number of consecutive closes go in your direction, maybe it is time to get out (the old “get out whole the getting’ is good” philosophy. George Costanza of the TV show Seinfeld called it “getting out on a high note.” http://www.youtube.com/watch?v=O27RzZEOkeA&t=1m20s

Exit Code:
EXIT #06 – Consec Closes
*****************************************************************
//calculate the number of consecutive up and down closes
input:InputVar2(3),InputVar4(3); //both go 3 to 5
var: upclose01(0),upclose02(0),upclose03(0),upclose04(0),upclose05(0),upclose06(0),upclose07(0),upclose08(0),upclose09(0),upclose10(0);
var:br(" ");
upclose01=0;upclose02=0;upclose03=0;upclose04=0;upclose05=0;
If (close[0]>close[1] and close[1]<=close[2]) then upclose01=upclose01+1;
If close[0]>close[1] and close[1]>close[2] and close[2]<=close[3] then upclose02=upclose02+1;
If close[0]>close[1] and close[1]>close[2] and close[2]>close[3] and close[3]<=close[4] then upclose03=upclose03+1;
If close[0]>close[1] and close[1]>close[2] and close[2]>close[3] and close[3]>close[4] and close[4]<=close[5] then upclose04=upclose04+1;
If close[0]>close[1] and close[1]>close[2] and close[2]>close[3] and close[3]>close[4] and close[4]>close[5] and close[5]<=close[6] then upclose05=upclose05+1;
//commented out, in case you want to look at more than 5 consec closes
//If close[0]>close[1] and close[1]>close[2] and close[2]>close[3] and close[3]>close[4] and close[4]>close[5] and close[5]>close[6] and close[6]<=close[7] then upclose06=upclose06+1;
//If close[0]>close[1] and close[1]>close[2] and close[2]>close[3] and close[3]>close[4] and close[4]>close[5] and close[5]>close[6] and close[6]>close[7] and close[7]<=close[8] then upclose07=upclose07+1;
//If close[0]>close[1] and close[1]>close[2] and close[2]>close[3] and close[3]>close[4] and close[4]>close[5] and close[5]>close[6] and close[6]>close[7] and close[7]>close[8] and close[8]<=close[9] then upclose08=upclose08+1;
//If close[0]>close[1] and close[1]>close[2] and close[2]>close[3] and close[3]>close[4] and close[4]>close[5] and close[5]>close[6] and close[6]>close[7] and close[7]>close[8] and close[8]>close[9] and close[9]<=close[10] then upclose09=upclose09+1;
//If close[0]>close[1] and close[1]>close[2] and close[2]>close[3] and close[3]>close[4] and close[4]>close[5] and close[5]>close[6] and close[6]>close[7] and close[7]>close[8] and close[8]>close[9] and close[9]>close[10] and close[10]<=close[11] then upclose10=upclose10+1;
//if lastbaronchart then print("up",br,upclose01,br,upclose02,br,upclose03,br,upclose04,br,upclose05,br,upclose06,br,upclose07,br,upclose08,br,upclose09,br,upclose10);
If InputVar2=3 and upclose03=1 then sell next bar at market;
If InputVar2=4 and upclose04=1 then sell next bar at market;
If InputVar2=5 and upclose05=1 then sell next bar at market;
var: dnclose01(0),dnclose02(0),dnclose03(0),dnclose04(0),dnclose05(0),dnclose06(0),dnclose07(0),dnclose08(0),dnclose09(0),dnclose10(0);
//var:br(" ");
dnclose01=0;dnclose02=0;dnclose03=0;dnclose04=0;dnclose05=0;
If (close[0]<close[1] and close[1]>=close[2]) then dnclose01=dnclose01+1;
If close[0]<close[1] and close[1]<close[2] and close[2]>=close[3] then dnclose02=dnclose02+1;
If close[0]<close[1] and close[1]<close[2] and close[2]<close[3] and close[3]>=close[4] then dnclose03=dnclose03+1;
If close[0]<close[1] and close[1]<close[2] and close[2]<close[3] and close[3]<close[4] and close[4]>=close[5] then dnclose04=dnclose04+1;
If close[0]<close[1] and close[1]<close[2] and close[2]<close[3] and close[3]<close[4] and close[4]<close[5] and close[5]>=close[6] then dnclose05=dnclose05+1;
//If close[0]<close[1] and close[1]<close[2] and close[2]<close[3] and close[3]<close[4] and close[4]<close[5] and close[5]<close[6] and close[6]>=close[7] then dnclose06=dnclose06+1;
//If close[0]<close[1] and close[1]<close[2] and close[2]<close[3] and close[3]<close[4] and close[4]<close[5] and close[5]<close[6] and close[6]<close[7] and close[7]>=close[8] then dnclose07=dnclose07+1;
//If close[0]<close[1] and close[1]<close[2] and close[2]<close[3] and close[3]<close[4] and close[4]<close[5] and close[5]<close[6] and close[6]<close[7] and close[7]<close[8] and close[8]>=close[9] then dnclose08=dnclose08+1;
//If close[0]<close[1] and close[1]<close[2] and close[2]<close[3] and close[3]<close[4] and close[4]<close[5] and close[5]<close[6] and close[6]<close[7] and close[7]<close[8] and close[8]<close[9] and close[9]>=close[10] then dnclose09=dnclose09+1;
//If close[0]<close[1] and close[1]<close[2] and close[2]<close[3] and close[3]<close[4] and close[4]<close[5] and close[5]<close[6] and close[6]<close[7] and close[7]<close[8] and close[8]<close[9] and close[9]<close[10] and close[10]>=close[11] then dnclose10=dnclose10+1;
//if lastbaronchart then print("dn",br,dnclose01,br,dnclose02,br,dnclose03,br,dnclose04,br,dnclose05,br,dnclose06,br,dnclose07,br,dnclose08,br,dnclose09,br,dnclose10);
If InputVar4=3 and dnclose03=1 then buytocover next bar at market;
If InputVar4=4 and dnclose04=1 then buytocover next bar at market;
If InputVar4=5 and dnclose05=1 then buytocover next bar at market;
Exits #7-11 Name: 200ATR Crew
Exit Description: This was one idea from a fellow trader in Houston, Texas. He thought maybe my earlier test of 10-20 period AverageTrueRange values was too volatile. He suggested a 200 period Average True Range, which could be close to 10 months on daily bars.
I broke this idea into little pieces (stops and/or targets), to be consistent with earlier analysis.
Exit Code:
InputVar52 will be varied as part of test.
Exit #7 – SetStopLoss(BigPointValue*InputVar52*AverageTrueRange(200);
Exit #8 – SetProfitTarget(BigPointValue*InputVar52*AverageTrueRange(200);
Exit #9 – SetStopLoss(BigPointValue*InputVar52*AverageTrueRange(200);
SetProfitTarget(BigPointValue*InputVar52*AverageTrueRange(200);
Exit #10 – Trailing exits
If marketposition=1 and openpositionprofit<maxpositionprofit-InputVar52*AvgTrueRange(200)*BigPointValue then sell next bar at market;
If marketposition=-1 and openpositionprofit<maxpositionprofit- InputVar52*AvgTrueRange(200)*BigPointValue then buytocover next bar at market;
Exit #11 – SetBreakEven(BigPointValue*InputVar52*AverageTrueRange(200);
Exit #12 and 13 Name: Ratch
Exit Description: This is another trailing type stop that ratchets up/down as trade moves in your direction. Exit 12 is based on Dollar amounts, and Exit 13 is based 100 period ATR.
Exit Code:
IP=Marketposition;
If IP<>IP[1] then MaxPP=0;
If OpenPositionProfit>MaxPP then MaxPP=OpenPositionProfit;
if MaxPP<1*InputVar44 then begin
SellP=Avgentryprice-InputVar52/BigPointValue +0*InputVar44/BigPointValue;
BuyTP=Avgentryprice+InputVar52/BigPointValue -0*InputVar44/BigPointValue;
End
else if MaxPP<2*InputVar44 then begin
SellP=Avgentryprice-InputVar52/BigPointValue +1*InputVar44/BigPointValue;
BuyTP=Avgentryprice+InputVar52/BigPointValue -1*InputVar44/BigPointValue;
End
else if MaxPP<3*InputVar44 then begin
SellP=Avgentryprice-InputVar52/BigPointValue +2*InputVar44/BigPointValue;
BuyTP=Avgentryprice+InputVar52/BigPointValue -2*InputVar44/BigPointValue;
End
else if MaxPP<4*InputVar44 then begin
SellP=Avgentryprice-InputVar52/BigPointValue +3*InputVar44/BigPointValue;
BuyTP=Avgentryprice+InputVar52/BigPointValue -3*InputVar44/BigPointValue;
End;
If marketposition=1 then sell next bar SellP stop;
If marketposition=-1 then buytocover next bar BuyTP stop;
Other Setup Info
Markets
I am going to test the exits on 40 different futures markets (Tradestation continuous contract symbols shown)
Currencies
@AD, @BP, @CD, @DX, @EC, @JY, @SF
Ags/Softs
@BO, @C, @CC, @CT, @FC, @KC, @KW, @LC, @LH, @O, @OJ, @RR, @S, @SB, @SM, @W
Metals
@GC, @HG, @PL, @SI
Energies
@CL, @HO, @NG, @RB
Interest Rates
@FV, @TY, @US
Stock Indices
@ES.D,@ES, @NK, @NQ, @RTY, @YM
Bar Sizes
Since results can vary dramatically depending on the size of the bar that is tested, I will test 5 different bar sizes:
60 minute
120 minute
360 minute
720 minute
1440 minute (daily)
Test Period
I will run all cases thru 10 years of data, from Jan 1, 2010 to Jan 1, 2020.
Other Test Criteria
As always, I will include proper amounts for slippage and commission in the study. Each market has its own value for slippage, based upon its liquidity and volume. I’ll use values that I have determined from real money trading, and also from in-depth analysis of bid-ask prices.
For some of the exits, the use of “Look Inside Bar Backtesting” is necessary to get accurate results. If you do not know what LIBB is, or why it is important, check out this video, starting at 8:02: https://youtu.be/tNWdJeHRZNE?t=482
How To Compare Results
Of course, when comparing 378,000 tests, the question “how do you determine what is best?” will inevitably come up.
I am going to look at 2 different metrics:
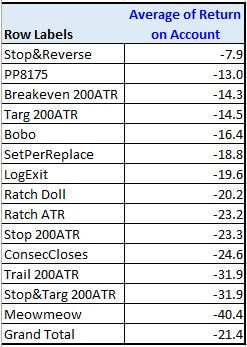
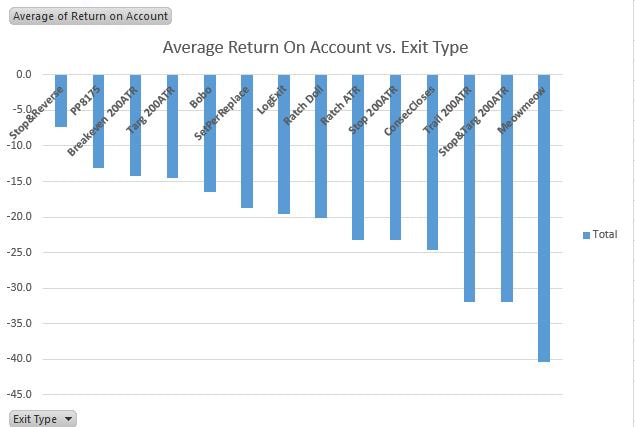
Return on Account = Total Net Profit / Maximum Drawdown (shown in charts and tables as “Average of Return On Account”)
# of Cases With Net Profit > $10K (shown in charts and tables as “Sum of Prof > $10K”)
Of course, I could write a whole article on why I chose these, and someone could counter with reasons why other performance metrics would be better.
My goal here was to compare risk adjusted returns, and also to identify which combinations produced a “good” overall Net Profit. My personal experience is that when both of these metrics are low, chances are the strategy entry and exit just are not that good.
Return on Account does have some issues with negative ROA. I have found that even with this issue, the overall results and conclusions presented below are not impacted by it.
Summary Of Testing
40 markets x 5 Bar Sizes x 5 Entries X 3 Lengths per Entry x 14 Exits (with Stop & Reverse) x 9 Settings Per Exit = 378,000 Unique Tests
If you work with Tradestation at all, you’ll soon realize that all of this testing would be very tedious and time consuming!
Luckily, I have a great helper tool. It is called Multi-Opt, and it automates a lot of the testing process. So, for example, you do not have to run unique optimizations on every market and bar size. Multi-Opt uses Tradestation’s OOEL (Object Oriented Easy Language) to speed the process up.
Unfortunately, Multi-Opt is not available to the general public, but it is available exclusively to students of my Strategy Factory workshop.
Even with Multi-Opt to speed up the testing, running all the cases actual took around 100 hours of non-stop testing, even after utilizing multi-threading.
IMPORTANT NOTE:
I’ll be showing the results I obtained from this testing; if you run tests yourself, you may get different results, and therefore reach different conclusions. You may program entries and exits differently than I did, or you may use different ranges for variables than I did.
And just because Exit A is better overall than Exit B with average performance metrics, it does not mean it is always better. Maybe certain markets or bar sizes like Exit B more than Exit A, for example.
The point here is that you can use the results I found to guide your research in testing, but ALWAYS verify results with your own testing/analysis. At the end of the day, you are going to be the person trading your account, so you should also be the person testing your particular strategies.
That being said, this study can be a huge timesaver for you. For instance, why bother testing systems with the worst exit? Focus on the good results first!
Results
Huge surprise (not!) – Stop & Reverse still is the best!
EXIT #06 – Consec Closes
*****************************************************************
//calculate the number of consecutive up and down closes
input:InputVar2(3),InputVar4(3); //both go 3 to 5
var: upclose01(0),upclose02(0),upclose03(0),upclose04(0),upclose05(0),upclose06(0),upclose07(0),upclose08(0),upclose09(0),upclose10(0);
var:br(" ");
upclose01=0;upclose02=0;upclose03=0;upclose04=0;upclose05=0;
If (close[0]>close[1] and close[1]<=close[2]) then upclose01=upclose01+1;
If close[0]>close[1] and close[1]>close[2] and close[2]<=close[3] then upclose02=upclose02+1;
If close[0]>close[1] and close[1]>close[2] and close[2]>close[3] and close[3]<=close[4] then upclose03=upclose03+1;
If close[0]>close[1] and close[1]>close[2] and close[2]>close[3] and close[3]>close[4] and close[4]<=close[5] then upclose04=upclose04+1;
If close[0]>close[1] and close[1]>close[2] and close[2]>close[3] and close[3]>close[4] and close[4]>close[5] and close[5]<=close[6] then upclose05=upclose05+1;
//commented out, in case you want to look at more than 5 consec closes
//If close[0]>close[1] and close[1]>close[2] and close[2]>close[3] and close[3]>close[4] and close[4]>close[5] and close[5]>close[6] and close[6]<=close[7] then upclose06=upclose06+1;
//If close[0]>close[1] and close[1]>close[2] and close[2]>close[3] and close[3]>close[4] and close[4]>close[5] and close[5]>close[6] and close[6]>close[7] and close[7]<=close[8] then upclose07=upclose07+1;
//If close[0]>close[1] and close[1]>close[2] and close[2]>close[3] and close[3]>close[4] and close[4]>close[5] and close[5]>close[6] and close[6]>close[7] and close[7]>close[8] and close[8]<=close[9] then upclose08=upclose08+1;
//If close[0]>close[1] and close[1]>close[2] and close[2]>close[3] and close[3]>close[4] and close[4]>close[5] and close[5]>close[6] and close[6]>close[7] and close[7]>close[8] and close[8]>close[9] and close[9]<=close[10] then upclose09=upclose09+1;
//If close[0]>close[1] and close[1]>close[2] and close[2]>close[3] and close[3]>close[4] and close[4]>close[5] and close[5]>close[6] and close[6]>close[7] and close[7]>close[8] and close[8]>close[9] and close[9]>close[10] and close[10]<=close[11] then upclose10=upclose10+1;
//if lastbaronchart then print("up",br,upclose01,br,upclose02,br,upclose03,br,upclose04,br,upclose05,br,upclose06,br,upclose07,br,upclose08,br,upclose09,br,upclose10);
If InputVar2=3 and upclose03=1 then sell next bar at market;
If InputVar2=4 and upclose04=1 then sell next bar at market;
If InputVar2=5 and upclose05=1 then sell next bar at market;
var: dnclose01(0),dnclose02(0),dnclose03(0),dnclose04(0),dnclose05(0),dnclose06(0),dnclose07(0),dnclose08(0),dnclose09(0),dnclose10(0);
//var:br(" ");
dnclose01=0;dnclose02=0;dnclose03=0;dnclose04=0;dnclose05=0;
If (close[0]<close[1] and close[1]>=close[2]) then dnclose01=dnclose01+1;
If close[0]<close[1] and close[1]<close[2] and close[2]>=close[3] then dnclose02=dnclose02+1;
If close[0]<close[1] and close[1]<close[2] and close[2]<close[3] and close[3]>=close[4] then dnclose03=dnclose03+1;
If close[0]<close[1] and close[1]<close[2] and close[2]<close[3] and close[3]<close[4] and close[4]>=close[5] then dnclose04=dnclose04+1;
If close[0]<close[1] and close[1]<close[2] and close[2]<close[3] and close[3]<close[4] and close[4]<close[5] and close[5]>=close[6] then dnclose05=dnclose05+1;
//If close[0]<close[1] and close[1]<close[2] and close[2]<close[3] and close[3]<close[4] and close[4]<close[5] and close[5]<close[6] and close[6]>=close[7] then dnclose06=dnclose06+1;
//If close[0]<close[1] and close[1]<close[2] and close[2]<close[3] and close[3]<close[4] and close[4]<close[5] and close[5]<close[6] and close[6]<close[7] and close[7]>=close[8] then dnclose07=dnclose07+1;
//If close[0]<close[1] and close[1]<close[2] and close[2]<close[3] and close[3]<close[4] and close[4]<close[5] and close[5]<close[6] and close[6]<close[7] and close[7]<close[8] and close[8]>=close[9] then dnclose08=dnclose08+1;
//If close[0]<close[1] and close[1]<close[2] and close[2]<close[3] and close[3]<close[4] and close[4]<close[5] and close[5]<close[6] and close[6]<close[7] and close[7]<close[8] and close[8]<close[9] and close[9]>=close[10] then dnclose09=dnclose09+1;
//If close[0]<close[1] and close[1]<close[2] and close[2]<close[3] and close[3]<close[4] and close[4]<close[5] and close[5]<close[6] and close[6]<close[7] and close[7]<close[8] and close[8]<close[9] and close[9]<close[10] and close[10]>=close[11] then dnclose10=dnclose10+1;
//if lastbaronchart then print("dn",br,dnclose01,br,dnclose02,br,dnclose03,br,dnclose04,br,dnclose05,br,dnclose06,br,dnclose07,br,dnclose08,br,dnclose09,br,dnclose10);
If InputVar4=3 and dnclose03=1 then buytocover next bar at market;
If InputVar4=4 and dnclose04=1 then buytocover next bar at market;
If InputVar4=5 and dnclose05=1 then buytocover next bar at market;
Exits #7-11 Name: 200ATR Crew
Exit Description: This was one idea from a fellow trader in Houston, Texas. He thought maybe my earlier test of 10-20 period AverageTrueRange values was too volatile. He suggested a 200 period Average True Range, which could be close to 10 months on daily bars.
I broke this idea into little pieces (stops and/or targets), to be consistent with earlier analysis.
Exit Code:
InputVar52 will be varied as part of test.
Exit #7 – SetStopLoss(BigPointValue*InputVar52*AverageTrueRange(200);
Exit #8 – SetProfitTarget(BigPointValue*InputVar52*AverageTrueRange(200);
Exit #9 – SetStopLoss(BigPointValue*InputVar52*AverageTrueRange(200);
SetProfitTarget(BigPointValue*InputVar52*AverageTrueRange(200);
Exit #10 – Trailing exits
If marketposition=1 and openpositionprofit<maxpositionprofit-InputVar52*AvgTrueRange(200)*BigPointValue then sell next bar at market;
If marketposition=-1 and openpositionprofit<maxpositionprofit- InputVar52*AvgTrueRange(200)*BigPointValue then buytocover next bar at market;
Exit #11 – SetBreakEven(BigPointValue*InputVar52*AverageTrueRange(200);
Exit #12 and 13 Name: Ratch
Exit Description: This is another trailing type stop that ratchets up/down as trade moves in your direction. Exit 12 is based on Dollar amounts, and Exit 13 is based 100 period ATR.
Exit Code:
IP=Marketposition;
If IP<>IP[1] then MaxPP=0;
If OpenPositionProfit>MaxPP then MaxPP=OpenPositionProfit;
if MaxPP<1*InputVar44 then begin
SellP=Avgentryprice-InputVar52/BigPointValue +0*InputVar44/BigPointValue;
BuyTP=Avgentryprice+InputVar52/BigPointValue -0*InputVar44/BigPointValue;
End
else if MaxPP<2*InputVar44 then begin
SellP=Avgentryprice-InputVar52/BigPointValue +1*InputVar44/BigPointValue;
BuyTP=Avgentryprice+InputVar52/BigPointValue -1*InputVar44/BigPointValue;
End
else if MaxPP<3*InputVar44 then begin
SellP=Avgentryprice-InputVar52/BigPointValue +2*InputVar44/BigPointValue;
BuyTP=Avgentryprice+InputVar52/BigPointValue -2*InputVar44/BigPointValue;
End
else if MaxPP<4*InputVar44 then begin
SellP=Avgentryprice-InputVar52/BigPointValue +3*InputVar44/BigPointValue;
BuyTP=Avgentryprice+InputVar52/BigPointValue -3*InputVar44/BigPointValue;
End;
If marketposition=1 then sell next bar SellP stop;
If marketposition=-1 then buytocover next bar BuyTP stop;
Other Setup Info
Markets
I am going to test the exits on 40 different futures markets (Tradestation continuous contract symbols shown)
Currencies
@AD, @BP, @CD, @DX, @EC, @JY, @SF
Ags/Softs
@BO, @C, @CC, @CT, @FC, @KC, @KW, @LC, @LH, @O, @OJ, @RR, @S, @SB, @SM, @W
Metals
@GC, @HG, @PL, @SI
Energies
@CL, @HO, @NG, @RB
Interest Rates
@FV, @TY, @US
Stock Indices
@ES.D,@ES, @NK, @NQ, @RTY, @YM
Bar Sizes
Since results can vary dramatically depending on the size of the bar that is tested, I will test 5 different bar sizes:
60 minute
120 minute
360 minute
720 minute
1440 minute (daily)
Test Period
I will run all cases thru 10 years of data, from Jan 1, 2010 to Jan 1, 2020.
Other Test Criteria
As always, I will include proper amounts for slippage and commission in the study. Each market has its own value for slippage, based upon its liquidity and volume. I’ll use values that I have determined from real money trading, and also from in-depth analysis of bid-ask prices.
For some of the exits, the use of “Look Inside Bar Backtesting” is necessary to get accurate results. If you do not know what LIBB is, or why it is important, check out this video, starting at 8:02: https://youtu.be/tNWdJeHRZNE?t=482
How To Compare Results
Of course, when comparing 378,000 tests, the question “how do you determine what is best?” will inevitably come up.
I am going to look at 2 different metrics:
Return on Account = Total Net Profit / Maximum Drawdown (shown in charts and tables as “Average of Return On Account”)
# of Cases With Net Profit > $10K (shown in charts and tables as “Sum of Prof > $10K”)
Of course, I could write a whole article on why I chose these, and someone could counter with reasons why other performance metrics would be better.
My goal here was to compare risk adjusted returns, and also to identify which combinations produced a “good” overall Net Profit. My personal experience is that when both of these metrics are low, chances are the strategy entry and exit just are not that good.
Return on Account does have some issues with negative ROA. I have found that even with this issue, the overall results and conclusions presented below are not impacted by it.
Summary Of Testing
40 markets x 5 Bar Sizes x 5 Entries X 3 Lengths per Entry x 14 Exits (with Stop & Reverse) x 9 Settings Per Exit = 378,000 Unique Tests
If you work with Tradestation at all, you’ll soon realize that all of this testing would be very tedious and time consuming!
Luckily, I have a great helper tool. It is called Multi-Opt, and it automates a lot of the testing process. So, for example, you do not have to run unique optimizations on every market and bar size. Multi-Opt uses Tradestation’s OOEL (Object Oriented Easy Language) to speed the process up.
Unfortunately, Multi-Opt is not available to the general public, but it is available exclusively to students of my Strategy Factory workshop.
Even with Multi-Opt to speed up the testing, running all the cases actual took around 100 hours of non-stop testing, even after utilizing multi-threading.
IMPORTANT NOTE:
I’ll be showing the results I obtained from this testing; if you run tests yourself, you may get different results, and therefore reach different conclusions. You may program entries and exits differently than I did, or you may use different ranges for variables than I did.
And just because Exit A is better overall than Exit B with average performance metrics, it does not mean it is always better. Maybe certain markets or bar sizes like Exit B more than Exit A, for example.
The point here is that you can use the results I found to guide your research in testing, but ALWAYS verify results with your own testing/analysis. At the end of the day, you are going to be the person trading your account, so you should also be the person testing your particular strategies.
That being said, this study can be a huge timesaver for you. For instance, why bother testing systems with the worst exit? Focus on the good results first!
Results
Huge surprise (not!) – Stop & Reverse still is the best!
This also holds up when you look at profitable and unprofitable cases. Basically, you want a lot of cases that have high profit (greater than $10,000, after slippage and commissions) and a minimal number of cases with low profit ($10,000 or larger loss). For this metric, we are looking for the largest quantity of highly profitable cases, the lowest quantity of unprofitable cases and the largest ratio of high profit to low profit cases:
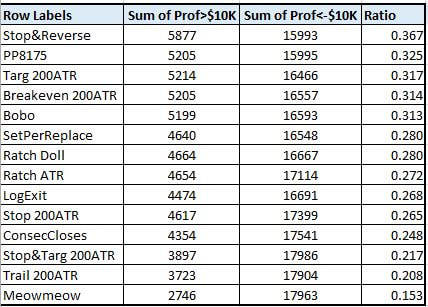
As you can see, Stop & Reverse is far and away the best exit by this measure, too.
Conclusion
Between this Exit Challenge, and the earlier Exit study I conducted, I looked at roughly 2 dozen different exit techniques. These exits composed a large variety of exit types and approaches.
Of all the exits tested, the simple Stop & Reverse performed the best. And really, it was not even close.
How To Use This In Your Own Development
1. Keep It Simple! – always start with simple Stop & Reverse exit. This is nice, because it help eliminate parameters to optimize. The less optimization, the better off you usually are.
2. Add Exits Sparingly – don’t add 10 different exits to your testing, and just pick the best one. Maybe try just a breakeven stop, or just a profit target stop. The tests I ran show there is no reason to go crazy.
3. Keep Looking – just because I found Stop & Reverse best, does not mean it is always best. You might find a great new exit – I encourage you to look!
As for my own testing, I plan to start with Stop & Reverse, and only add other exits is absolutely necessary.
I hope you found this exit study helpful, and thanks to all who participated!

About The Author: Kevin Davey is an award winning private futures, forex and commodities trader. He has been trading for over 30 years.Three consecutive years, Kevin achieved over 100% annual returns in a real time, real money, year long trading contest, finishing in first or second place each of those years.
Kevin is the author of the highly acclaimed algorithmic trading book "Building Algorithmic Trading Systems: A Trader's Journey From Data Mining to Monte Carlo Simulation to Live Trading" (Wiley 2014). Kevin provides a wealth of trading information at his website: http://www.kjtradingsystems.com
Copyright, Kevin Davey and KJ Trading Systems. All Rights Reserved. Reprint of above article is permitted, as long as the About The Author information is included.