
How To Prevent Algo Trading "Analysis And Paralysis"

Reward:Risk - you can throw it out on the window. Winning Percentage - you can toss that one away, too.
Probably the two most popular trading statistics are basically useless - by themselves. And unfortunately, that is exactly how many people use them.
Many traders will jump into a trade with a reward to risk of 3:1, just because they can win $3, and only lose $1.
Other traders are attracted to 90% winning percentage strategies like moths to a flame. They must enjoy the frequent sound of the cash register, ringing after each win. No doubt, 9 out of 10 wins does sound pretty good.
But, in both cases, the traders following these approaches are missing a critical piece of the puzzle.
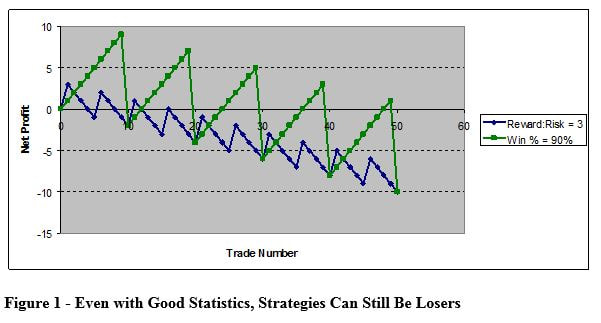
Figure 1 shows two equity curves. The blue curve is a 3:1 reward to risk system. The green curve is a 90% winning percentage system. Both are systems with appealing standalone statistics, yet both systems are losers. Why?
Probably the two most popular trading statistics are basically useless - by themselves. And unfortunately, that is exactly how many people use them.
Many traders will jump into a trade with a reward to risk of 3:1, just because they can win $3, and only lose $1.
Other traders are attracted to 90% winning percentage strategies like moths to a flame. They must enjoy the frequent sound of the cash register, ringing after each win. No doubt, 9 out of 10 wins does sound pretty good.
But, in both cases, the traders following these approaches are missing a critical piece of the puzzle.
Figure 1 shows two equity curves. The blue curve is a 3:1 reward to risk system. The green curve is a 90% winning percentage system. Both are systems with appealing standalone statistics, yet both systems are losers. Why?
Simply put, those trading metrics by themselves are insufficient. Alone, they tell you only part of the story. Combining them is the key.
When Reward:Risk and winning percentage are evaluated together, it becomes very easy to determine what is a good strategy, and what is a poor strategy.
The equation is shown below:
(Win %/100) * (Reward:Risk) - [(100 - Win%)/100]
As long as this equation is greater than zero, the strategy will be profitable. Additionally, the higher the resulting the number, the better the system. Many good, tradable systems can be found with resulting values between 0.10 and 0.50.
The resulting value is commonly referred to expectancy, and is an excellent statistic. It tells you the amount of money you'd win per dollar risked. For example, a value of 0.20 indicates that in the long run you'll make 20 cents for every dollar you risk trading this system. In other words, it is a really good system.
NOTE: If you do an Internet search, you might find some conflicting definitions for expectancy. To clear it up, here is how I define the terms (you can visit my Calculator page to calculate expectancies automatically).
Expectancy = (Probability of Win * Average Win) – (Probability of Loss * Average Loss)
This is equivalent to the average trade value.
The correct equation for Tharp expectancy divides by the negative of the average loss:
Tharp Expectancy = ((Probability of Win * Average Win) – (Probability of Loss * Average Loss))/(-Average Loss)
This correct equation, rearranged in terms of Reward:Risk, is used as the basis for other equations in this article.
What does this equation look like for the earlier examples? Let's take a look. In the Figure 1 blue curve, the Reward: Risk was 3 to 1. But, the winning percentage (not initially disclosed) was only 20%. Plugging these numbers in, we get
(20/100) * (3) - [(100 - 20)/100]= -0.2
Since this is less than zero, the strategy is a losing one. Any trader using such a strategy will eventually, and inevitably, go broke trading it.
In the Figure 1 green curve, the winning percentage was given as 90%, but the Reward:Risk was only 0.091. Plugging those numbers in, we get another losing strategy.
(90/100) * (.091) - [(100 - 90)/100]= -0.018
So, the Reward:Risk and winning percentages by themselves do not convey enough information. Yet together, they form a powerful method of evaluating a system.
This is shown in Figure 2.
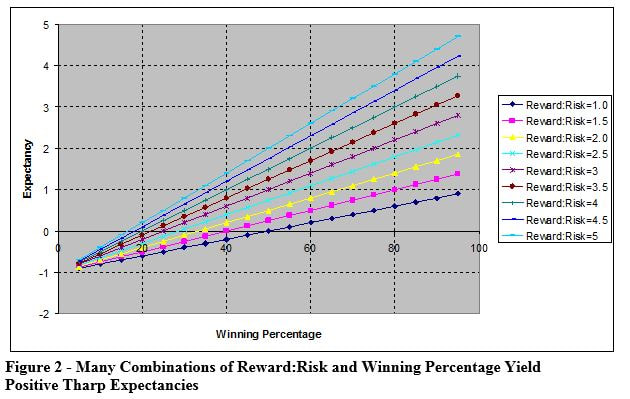
Many different combination sets of Reward:Risk and winning percentage produce winning strategies. As you can see, you can make money with a low Reward:Risk, and you can also be profitable with a small winning percentage.
Even though by themselves these statistics don't tell you enough, they do have some psychological benefit. Most people were taught in school that high winning percentages were important - everyone wanted a 90% score for an "A" - and many cling to this belief while trading.
So, having a low winning percentage might be impossible for many traders to stomach. Understandably, losing on 7 or 8 trades out of every 10 will be hard on most trader's psyche.
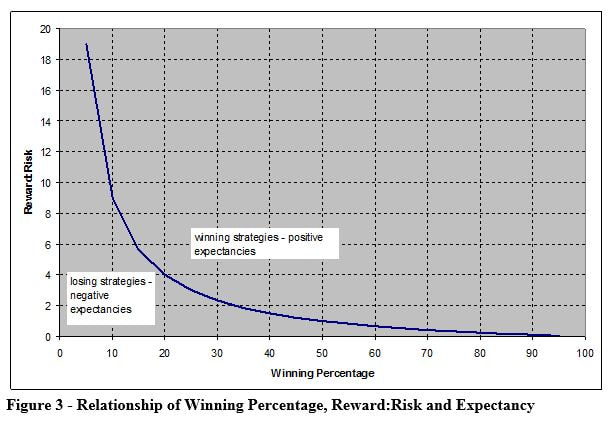
If you know your desired winning percentage, though, the equation presented earlier can be arranged to tell you the minimum Reward:Risk you need:
For positive expectancy, R:R > [(100-win%)/100] / (win %/100)
In the same manner, the equation can be rearranged to return the necessary winning percentage for a given Reward:Risk ratio:
For positive expectancy, win % > 100/(R:R +1)
Using these two modified equations, it is easy to determine the minimum requirements for profitability. This is also shown in Figure 3. Any strategies above the line will be profitable, while those below the line will be losers, and should be avoided.
Even though by themselves these statistics don't tell you enough, they do have some psychological benefit. Most people were taught in school that high winning percentages were important - everyone wanted a 90% score for an "A" - and many cling to this belief while trading.
So, having a low winning percentage might be impossible for many traders to stomach. Understandably, losing on 7 or 8 trades out of every 10 will be hard on most trader's psyche.
If you know your desired winning percentage, though, the equation presented earlier can be arranged to tell you the minimum Reward:Risk you need:
For positive expectancy, R:R > [(100-win%)/100] / (win %/100)
In the same manner, the equation can be rearranged to return the necessary winning percentage for a given Reward:Risk ratio:
For positive expectancy, win % > 100/(R:R +1)
Using these two modified equations, it is easy to determine the minimum requirements for profitability. This is also shown in Figure 3. Any strategies above the line will be profitable, while those below the line will be losers, and should be avoided.
Using the concepts presented thus far, it is easy to evaluate real world trading strategies. Table 1 presents four futures trading strategies. All have some appealing aspects, whether it is high Winning Percentage, or high Reward:Risk ratio.
Using the concepts presented thus far, it is easy to evaluate real world trading strategies. Table 1 presents four futures trading strategies. All have some appealing aspects, whether it is high Winning Percentage, or high Reward:Risk ratio.
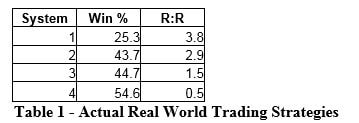
But, of these four algo trading systems, which are profitable? Which one is the "best?" Plotting the systems on the Reward:Risk vs. Winning Percentage curve gives the answers. This is shown in Figure 4.
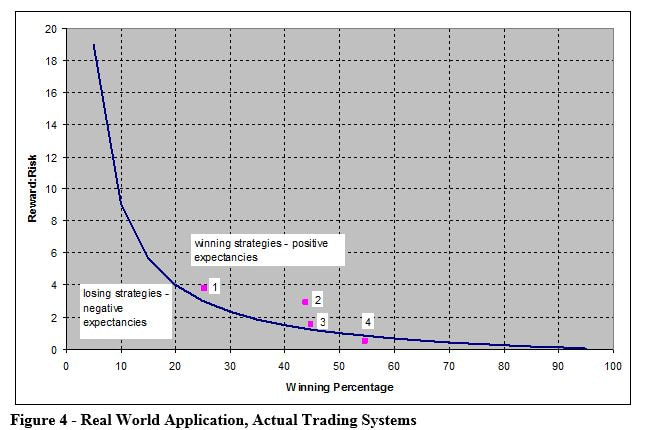
With the four trading strategies plotted on the Reward:Risk vs. Winning Percentage plot, it is easy to immediately eliminate system 4, since it is a negative expectancy, losing strategy. This is a good example of a high winning percentage system not necessarily being a profitable system.
The other three strategies all have positive expectancy, but which is best? Some people will favor system 1, since it has the highest Reward:Risk ratio. The thrill of the occasional "jackpot" trade entices some traders, even if the winning percentage is low. Internet forums abound with traders like this, bragging about how they hit "the big one."
Other people will like system 3 the most, since it has the highest winning percentage of the three profitable systems. These traders like to hear the cash register ring often from winning trades, even if those wins are relatively small. These are the traders who usually seem to win, and may even attract followers because of their seemingly prescient predictions.
But, psychological reasons aside, the best system to trade is system number 2. As shown in Figure 4, it is the furthest away from the breakeven line. Therefore, the expectancy of system 2 is the highest. It does not have the best Reward:Risk ratio, and it does not have the best Winning Percentage, but it does have the best combination of the two statistics.
At this point, hopefully it is clear that Reward:Risk and Winning Percentage are, by themselves, quite useless. The same can be said about other trading statistics, such as net profit (which needs drawdown to quantify risk), consecutive winners/losers (which needs overall winning percentage for perspective) and average trade profit (which needs numbers of trades to gauge overall profitability). In each of these cases, the single statistic does not tell you enough about the strategy.
Even expectancy, by itself, does not tell the whole story. A lower expectancy system that trades frequently may indeed be preferable to a higher expectancy, but infrequently traded strategy. Again, focusing on just one number may lead to incorrect conclusions.
The key, then, becomes to evaluate all the pertinent statistics of a strategy at the same time. That way, some "bad" statistics can be overcome with the help of complementary statistics. In the end analysis, a thorough evaluation of all trading statistics, taken together, is the best approach for a good decision.

About Author: Kevin Davey is an award winning private futures, forex and commodities trader. He has been trading for over 25 years.Three consecutive years, Kevin achieved over 100% annual returns in a real time, real money, year long trading contest, finishing in first or second place each of those years.
Kevin is the author of the highly acclaimed algorithmic trading book "Building Algorithmic Trading Systems: A Trader's Journey From Data Mining to Monte Carlo Simulation to Live Trading" (Wiley 2014). Kevin provides a wealth of trading information at his website: http://www.kjtradingsystems.com
Copyright, Kevin Davey and KJ Trading Systems. All Rights Reserved. Reprint of above article is permitted, as long as the About The Author information is included.